From cricket scores to class surveys: data science explained for students, parents and school leaders
A practical beginner's guide to data science for Indian schools: what it is in plain words, the data lifecycle, how it links to statistics and AI, class-friendly projects, privacy and ethics, and a checklist for teachers and principals.
Introduction
Every day students see numbers: cricket scores, temperature readings, test marks, bus timings. Data science is the skill of turning numbers like these into useful answers. For Indian schools it links maths, science and computers. This guide explains data science in plain words, walks through the data lifecycle, shows how it relates to statistics and AI, suggests class-friendly projects, and ends with privacy rules and a short checklist for teachers and principals.
What is data science, in simple words?
Data science is the practice of using data to answer questions and make better decisions. Data is simply recorded information: numbers, words, dates or measurements. A data scientist asks a question, gathers information, organises it, finds patterns and explains them.
Think of it like detective work: collect clues, discard ones that do not fit, look for links and explain the case. In data science the clues sit in rows and columns, and the explanation is a chart or clear summary.
The data lifecycle: from question to conclusion
Most data projects follow the same six steps. Ask a question that data can answer, such as 'Which day of the week has the most late arrivals at our school gate?' Collect data by counting, measuring or surveying. Clean it by fixing typing errors, removing duplicates and handling missing values.
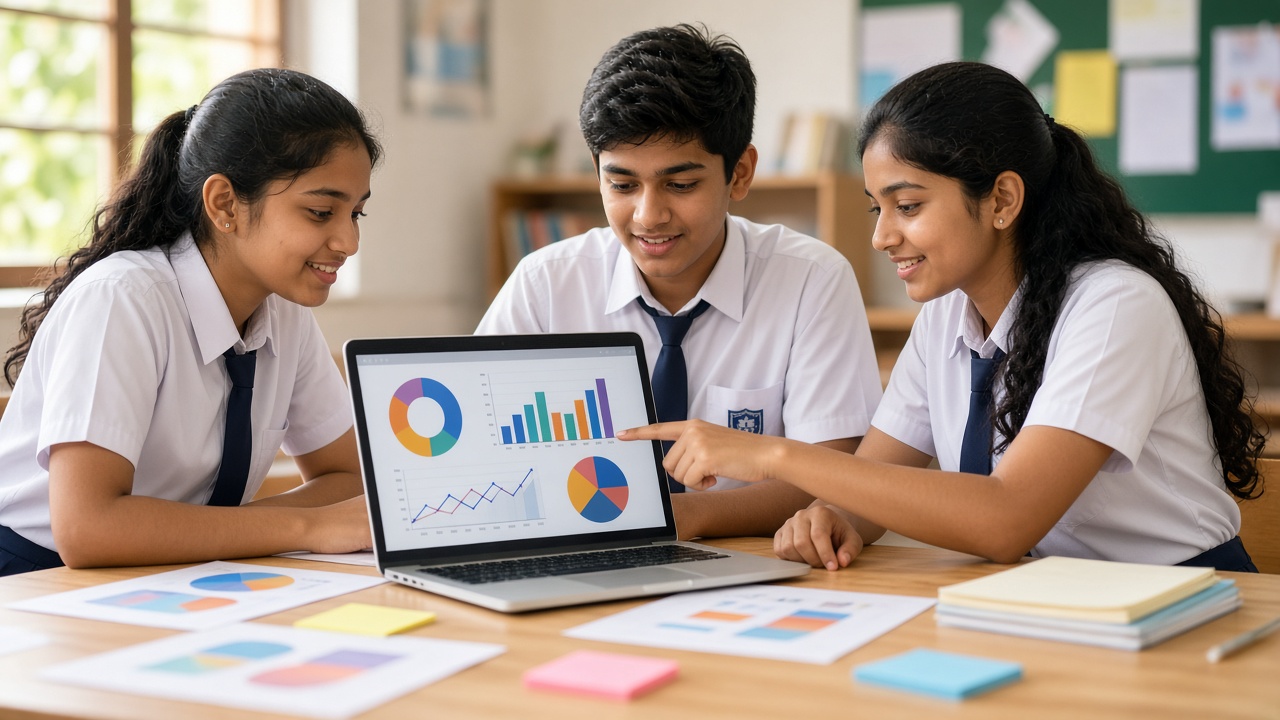
Next, explore the data. Sort it, count it and calculate simple measures such as the average (mean), the middle value (median) and the most common value (mode). Then visualise it with a bar chart, line graph or pie chart so patterns are easy to see.
Finally, conclude. Write what the data shows, what it does not show and what to check next; a pattern in one month may not hold all year. Saying 'the data suggests' instead of 'this proves' is how data scientists think.
How data science relates to statistics, AI and machine learning
Statistics is the mathematical foundation of data science. It helps summarise data, measure spread and judge whether a pattern is real or just chance. Mean, median, mode and graphs already appear in school maths.
AI and machine learning use data to learn patterns and make predictions. A machine learning model is only as good as the data it learns from, so cleaning, checking and understanding data comes first. Students who have read about machine learning, computer vision or generative AI will find that all of them depend on well-prepared data.
Everyday examples students already know
Cricket is full of data. Batting average, strike rate and run rate are all calculations based on recorded scores. Team analysts study past matches to plan for the next one.
Weather forecasts combine readings of temperature, rainfall, wind and humidity collected over time. School attendance registers are data too: a teacher can spot which weeks have lower attendance and ask why, perhaps because of festivals, exams or the monsoon. Even a canteen deciding how many samosas to prepare is using data.
Class-friendly projects by class level
Classes 3 to 5: Run a class survey on favourite fruits, games or ways of coming to school. Make a tally chart on paper, then a simple bar graph. Discuss which answer is most common.
Classes 6 to 8: Record the daily temperature or rainfall for a month using a school thermometer or a simple rain gauge. Enter the readings in a free spreadsheet tool, calculate mean, median and mode, and draw a line graph.
Classes 9 to 12: Pick a question about the school, such as weekly paper use, collect data with permission, clean it in a spreadsheet and present findings with charts. Students ready for more can try beginner Python for data analysis. Always end with a short written conclusion and a list of limitations.
Data privacy and ethics for students
Data about people deserves respect. Students should not collect names, phone numbers, addresses, photos or marks of classmates without clear permission from the teacher and, where needed, parents. Use anonymous survey answers where possible.
Ethics also means honesty. Do not delete data just because it spoils the pattern you hoped for, and do not draw charts that exaggerate differences. Say where the data came from. India's data protection rules are evolving, so schools should check the latest official guidelines and their own policies before running projects that involve personal information.
Skills it builds and where it can lead
Data science builds skills that help in any subject: asking sharp questions, organising information, basic statistics, reading graphs critically and explaining findings clearly. These habits also help students judge claims in the news.
Healthcare, agriculture, sports, business and research all use data, and roles such as data analyst and data scientist are often discussed as career options. Paths and requirements change, so students should explore current college courses and talk to teachers or counsellors before deciding.
A short checklist for teachers and principals
Start with questions students care about, such as sports, weather, the canteen or school events. Use tools the school already has, and keep paper-based activities for younger classes.
Set clear data rules: no personal details without permission, anonymous surveys where possible, and files saved only on approved devices.
Link projects to maths topics such as averages and graphs, to science experiments and to social studies surveys. NEP 2020 and CBSE materials discuss data handling and computational skills; check the latest official guidelines for your board and class. Plan a short showcase where students present their charts.
Frequently asked questions
Q: Do students need to know coding to learn data science? A: No. Younger students can start with tally charts and spreadsheets. Coding, often in Python, helps later with larger data sets.
Q: Is data science the same as AI? A: Not exactly. Data science focuses on understanding data and answering questions with it. AI uses data to build systems that can make predictions or decisions. The two overlap.
Q: What age is right to start? A: Simple counting, sorting and bar graphs suit primary classes. Spreadsheets and averages fit middle school, and deeper analysis or beginner coding suits senior classes. The key is matching the activity to the student's maths level.
Build data confidence into your school's STEM journey with SheepByte
SheepByte is an AI and robotics education company based in Udaipur, Rajasthan. Our AI Learning, Coding Bootcamp and STEM Integration programmes help students work with data, code and real-world problems. We also offer Robotics Lab, Innovation Club and Drone Technology programmes, plus workshops in Jaipur, Delhi and online, and we help schools set up robotics labs.
If you want to explore AI learning, coding or STEM integration for your school or child, write to support@sheepbyte.com or visit sheepbyte.com.